
Inspecting Shadow DOM in Native Controls Using Chrome DevTools
A technical deep-dive into inspecting and debugging Shadow DOM in native HTML controls using Chrome DevTools.
Inspecting Shadow DOM in Native Controls Using Chrome DevTools
As web developers, we often work with native HTML elements like , , and . While they seem straightforward, their behavior and presentation are often controlled by internal structures hidden inside the Shadow DOM. When you're debugging UI inconsistencies or styling quirks, being able to inspect and manipulate the Shadow DOM becomes crucial.
Understanding Shadow DOM in Native Elements
The Shadow DOM is a powerful browser feature that encapsulates part of the DOM, shielding it from outside styles and scripts. Think of it as a built-in safeguard—like a sealed container—allowing native controls to behave consistently across platforms without interference from your CSS or JavaScript[^1].
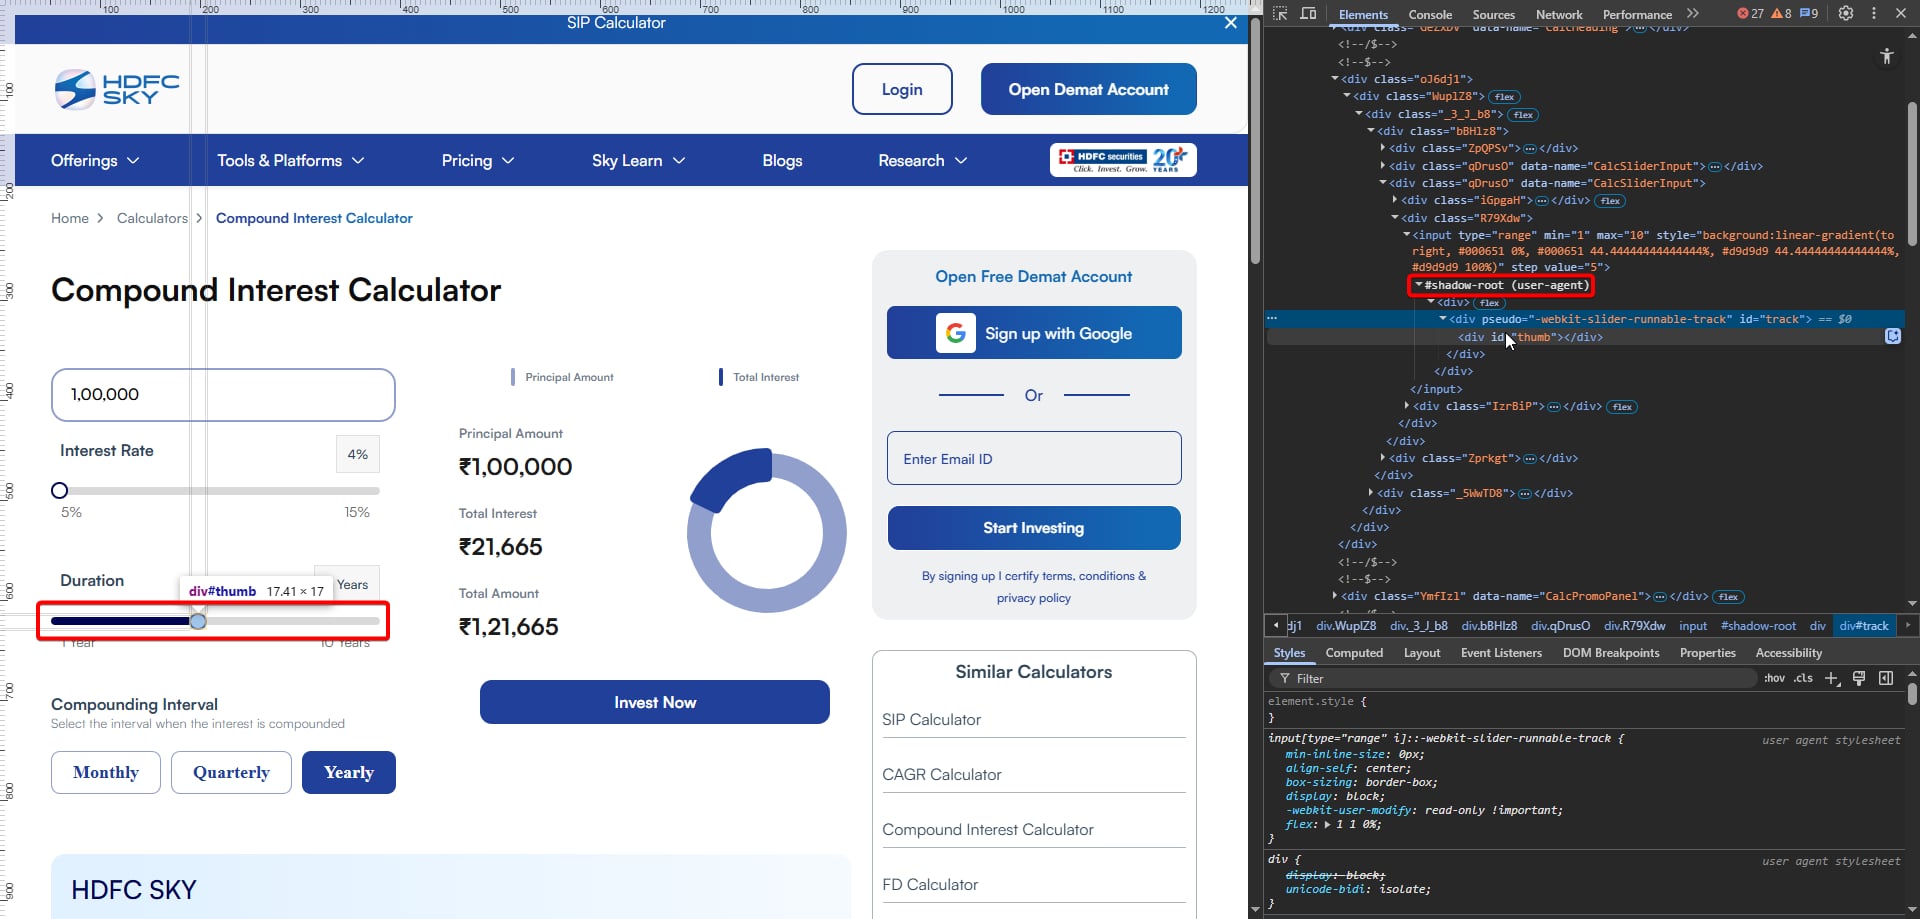
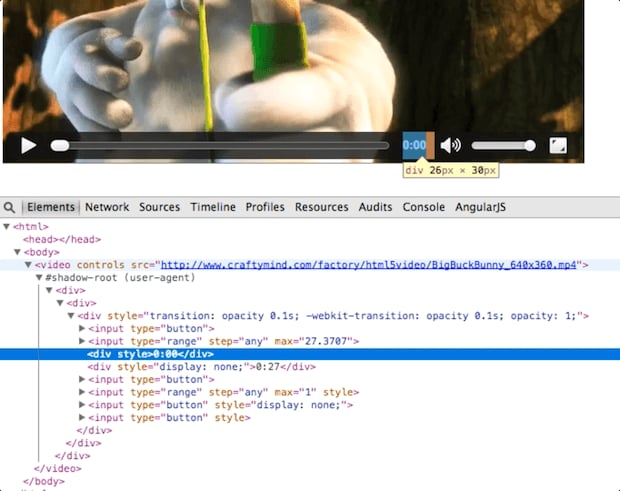
Many native elements—especially those with built-in UI like or —leverage the Shadow DOM to isolate their internal components. This ensures consistent behavior and styling across different browsers[^2]. How to Inspect Shadow DOM in Chrome DevTools Enable Shadow DOM Visibility Chrome DevTools supports Shadow DOM inspection out of the box, but to confirm it’s enabled:
- Open DevTools (F12 or right-click → Inspect).
- Click the gear icon (⚙️) to open Settings.
- Under the Preferences tab, go to Elements.
- Check "Show user agent shadow DOM".
💡 Tip: Always keep Chrome updated. DevTools evolves rapidly and introduces new features regularly[^3].
Exploring Shadow Roots in Native Controls
To view the Shadow DOM of a native element:
- Select the element in the Elements panel.
- Look for a triangle or arrow indicating a shadow root.
- Expand it to see internal components like labels, inputs, and buttons.
Hands-On Techniques for Shadow DOM Debugging
The Elements panel visually distinguishes shadow roots with boundaries. Once expanded, you can inspect the internal hierarchy and styles like any other DOM subtree.
With an open shadow root, you can:
- Inspect computed styles.
- Modify HTML nodes and attributes.
- Inject CSS and see changes reflected live.
For programmatic access, you can use:
const input = document.querySelector('input[type="date"]');
const shadowRoot = input.shadowRoot;
This will work only for open shadow roots[^4].
Working with Closed Shadow DOM
- Open Shadow DOM: You can access it via DevTools or JavaScript.
- Closed Shadow DOM: Hidden from direct JavaScript access.
DevTools may still display some parts of closed shadow roots. While direct scripting access isn’t possible, event listeners and interactions can sometimes expose clues.
Best Practices for Shadow DOM Debugging
- Pin the Elements and Console tabs.
- Use keyboard shortcuts (e.g., Cmd/Ctrl + Shift + C to inspect).
- Save reusable console snippets.
Chrome’s DevTools [release notes][^5] provide detailed updates on Shadow DOM features. Reviewing these periodically helps you stay sharp.
Conclusion
Shadow DOM isn’t just a curiosity—it’s a critical part of modern frontend development. With Chrome DevTools, you can inspect, style, and experiment with native controls’ internal DOM like a pro. Understanding how to work with both open and closed shadow roots will elevate your debugging game and deepen your understanding of the browser internals.
Whether you're optimizing a form UI or troubleshooting custom controls, mastering the Shadow DOM is a vital skill for any serious frontend engineer.
Footnotes & References
[^1]: What is Shadow DOM – MDN
[^2]: Native HTML elements using Shadow DOM – CSS Tricks
[^3]: DevTools Settings – Chrome Docs
[^4]: Working with shadow DOM in JavaScript – Web.dev
[^5]: Chrome DevTools Release Notes